Hello warriors, to have an extra edge over other candidates in ssb you need to have something different. With this simple motive, I am here to share some STATISTICS on different government policies, schemes and other initiatives. I assure you all that if you would be able to elaborate your sayings with a mixture of these statistics it would be fruitful.


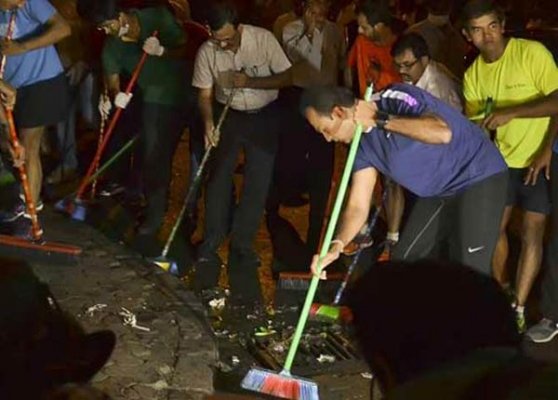
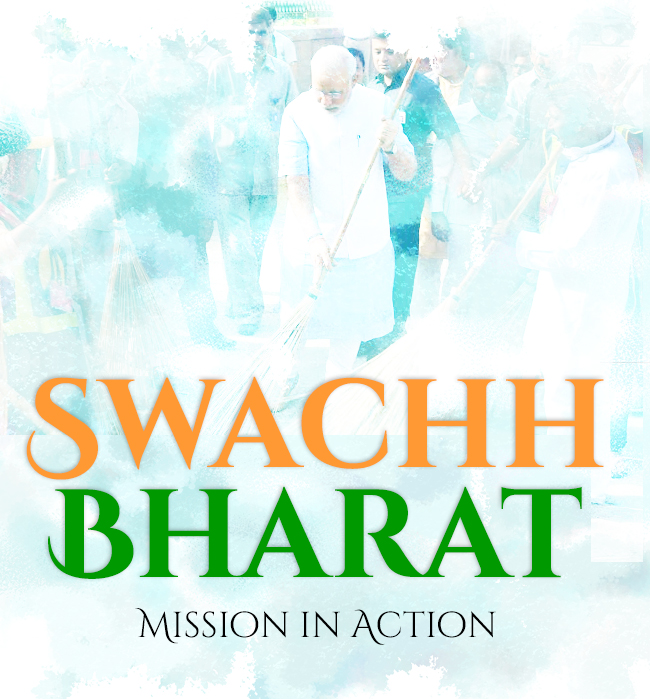
Statistics On Swacch Bharat Abhiyaan(Clean India Mission)
- Total budget – Rs. 60,000cr per year.
- 68% of rural households have no toilets.
- 78% sewage dumped in rivers.
- 6000 tonnes of plastic waste littered daily.
- 68.8mn tonnes of waste per year.
- 41mn missing toilets.
- 597mn(approx. 600mn) defecating in the open.
- Even poorer countries fare better.
- Lack of sanitation is costing India 6.4% GDP.
- Good sanitation could boost annual per capita income by Rs. 6000 a year.
- Yet we spend 260 times more on food than sanitation.
- E.g. $26bn spending on subsidized food and $200mn spending on sanitation.
Percentage Defecation in open by some countries:
- INDIA- 48%
- AFGHANISTAN- 15%
- CONGO- 8%
- BURUNDI- 3%
- BANGLADESH- 3%
Flowchart representation for better understanding:
Open defecation—->tainted water & food—–>Bacteria, intestinal worms—->poor absorption of nutrients—–>Malnutrition.
Open defection—–>Faeces in groundwater—->-Diarrhea & encephalitis


Also Read
- Mastering the Group Discussion in the SSB Interview
- Five Resolutions That Aspirants Must Have For The New Year
- Clearing Confusion Related to AFCAT Exam
 About Abhishek Kumar
I am Abhishek from Pathankot, Punjab. I have done my B.tech in ECE and have availed 3 chances in SSB. So I am currently leaving no stone unturned towards dedicated efforts for getting selected in ARMY.